Module 3: Exercise Results
data(BreastCancer)
bc <- BreastCancer
for (k in 2:10) # altered for current lab
    bc[,k] <- as.numeric(bc[,k])
head(bc)
## Id Cl.thickness Cell.size Cell.shape Marg.adhesion Epith.c.size Bare.nuclei Bl.cromatin
## 1 1000025 5 1 1 1 2 1 3
## 2 1002945 5 4 4 5 7 10 3
## 3 1015425 3 1 1 1 2 2 3
## 4 1016277 6 8 8 1 3 4 3
## 5 1017023 4 1 1 3 2 1 3
## 6 1017122 8 10 10 8 7 10 9
## Normal.nucleoli Mitoses Class
## 1 1 1 benign
## 2 2 1 benign
## 3 1 1 benign
## 4 7 1 benign
## 5 1 1 benign
## 6 7 1 malignantExplore missingness:
suppressMessages(require(plotrix))

#' show data missingness as a chequered matrix
#'
#' @param x (matrix) data matrix.
#' @param outFile (char) path to file for printing graph
#' @param wd (numeric) width in inches
#' @param ht (numeric) height in inches
#' @return plots missingness matrix to file
#' @import plotrix
#' @export
plotMissMat <- function(x,xlab="columns",
        ylab="rows",border=NA) {

    x <- !is.na(x)
    class(x) <- "numeric"
    color2D.matplot(x,show.values=FALSE,axes=FALSE,
        cs1=c(1,0),cs2=c(1,0),cs3=c(1,0),border=border,
        cex=0.8,
        xlab=xlab,ylab=ylab)
}
Explore missingness:
plotMissMat(bc)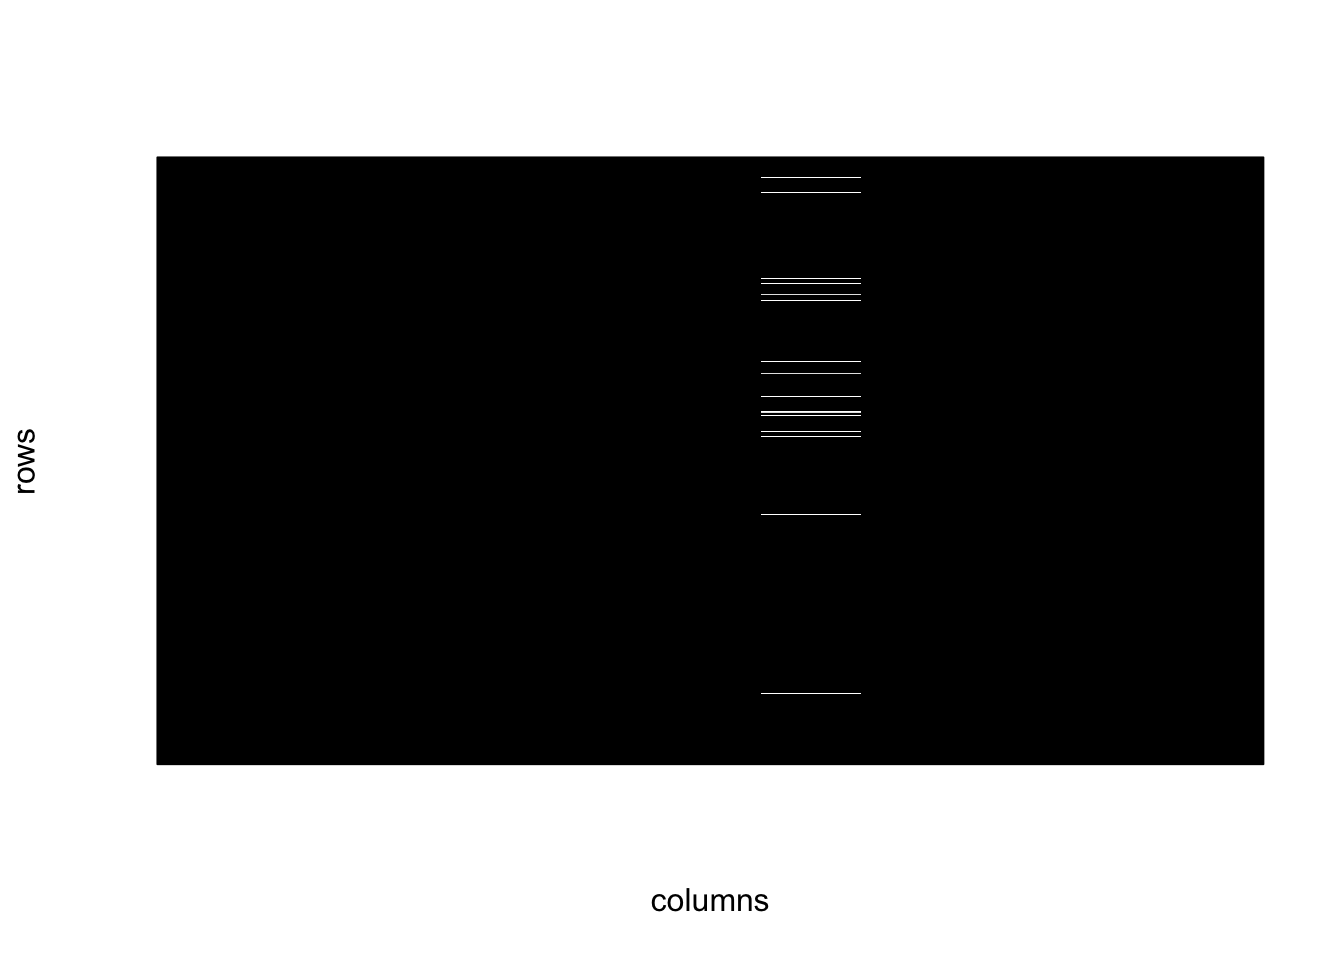
colSums(is.na(bc))## Id Cl.thickness Cell.size Cell.shape Marg.adhesion Epith.c.size
## 0 0 0 0 0 0
## Bare.nuclei Bl.cromatin Normal.nucleoli Mitoses Class
## 16 0 0 0 0Plot relationship between variables
require(ggplot2)

ggplot(bc,aes(Cell.size,Normal.nucleoli)) + geom_point()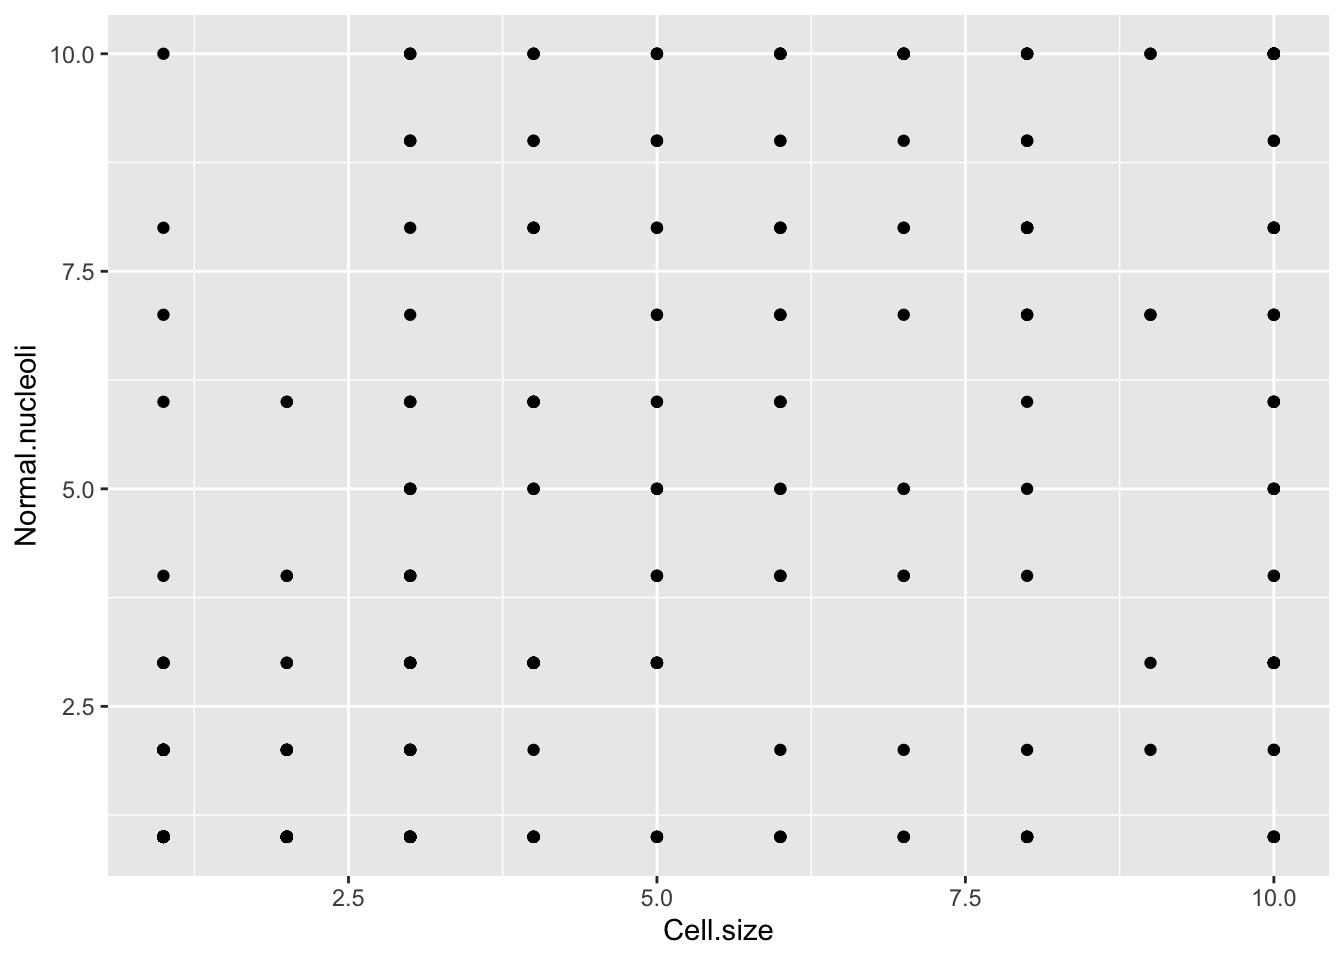
ggplot(bc) + geom_boxplot(aes(factor(Class), Normal.nucleoli))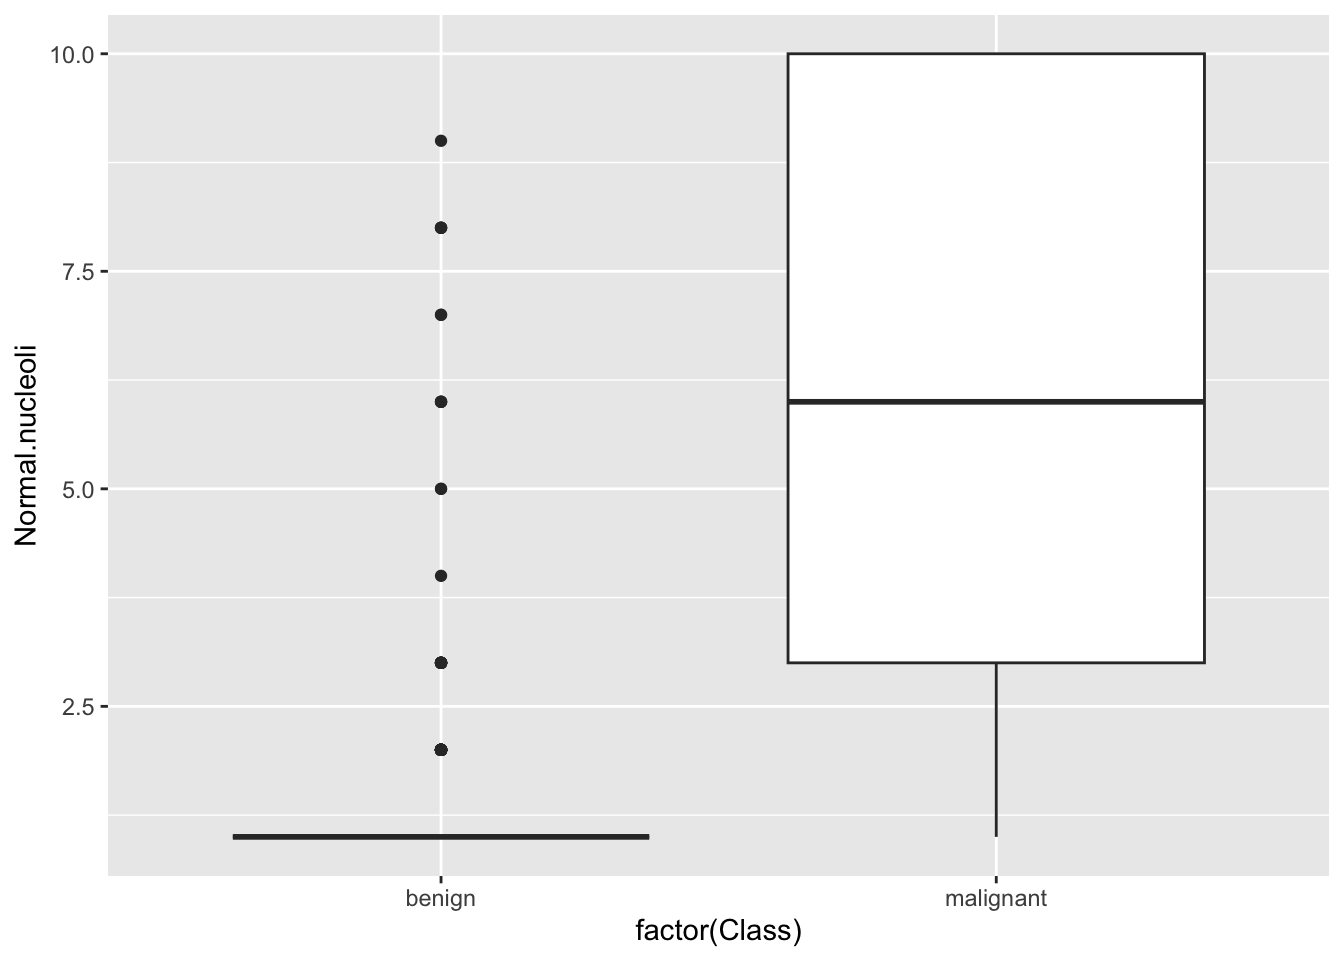
ggplot(bc) + geom_boxplot(aes(factor(Class), Cl.thickness))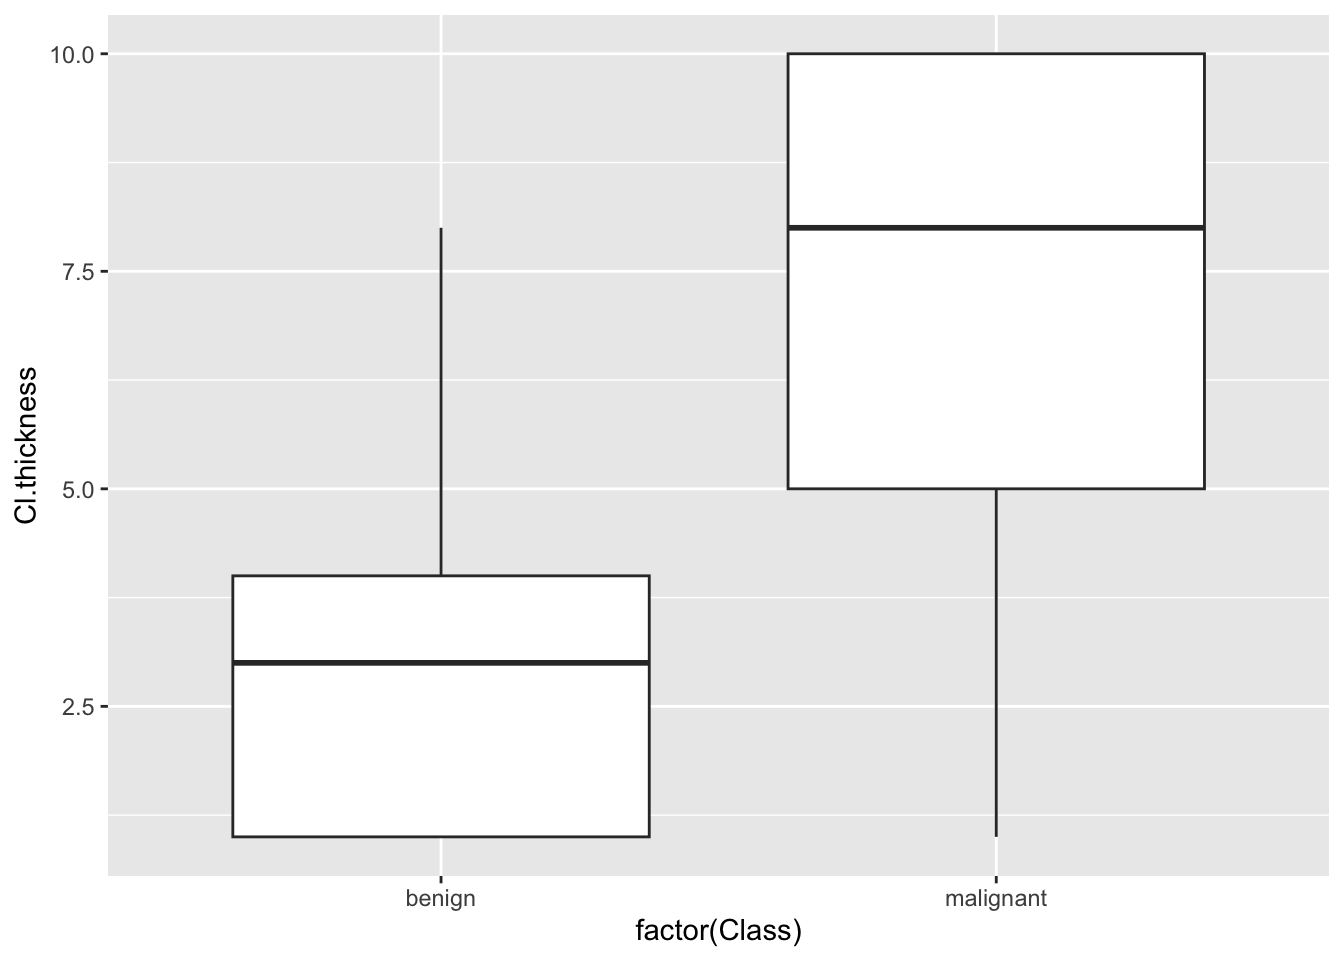
ggplot(bc) + geom_boxplot(aes(factor(Class), Bare.nuclei))## Warning: Removed 16 rows containing non-finite values (`stat_boxplot()`).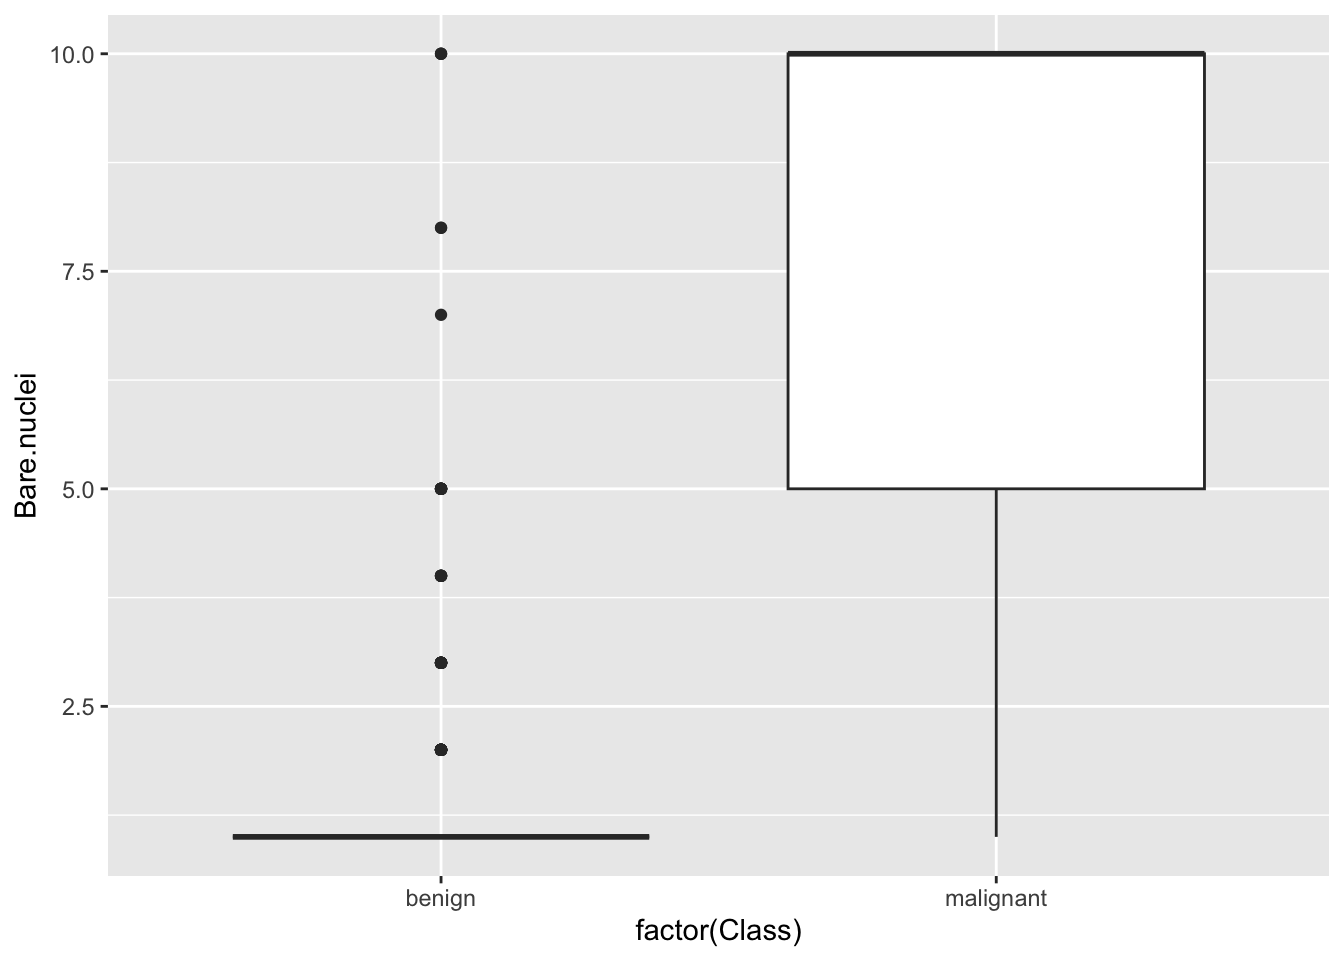
Fit a binary outcome model:
mod <- glm(
    Class ~ Cl.thickness + Bare.nuclei + Normal.nucleoli + Mitoses + Bl.cromatin,
    bc,
    family="binomial")
summary(mod)
##
## Call:
## glm(formula = Class ~ Cl.thickness + Bare.nuclei + Normal.nucleoli +
## Mitoses + Bl.cromatin, family = "binomial", data = bc)
##
## Deviance Residuals:
## Min 1Q Median 3Q Max
## -3.7840 -0.1459 -0.0768 0.0324 2.7798
##
## Coefficients:
## Estimate Std. Error z value Pr(>|z|)
## (Intercept) -9.69635 0.98763 -9.818 < 2e-16 ***
## Cl.thickness 0.63413 0.12267 5.169 2.35e-07 ***
## Bare.nuclei 0.50988 0.08228 6.197 5.76e-10 ***
## Normal.nucleoli 0.35765 0.10040 3.562 0.000368 ***
## Mitoses 0.52677 0.27923 1.887 0.059223 .
## Bl.cromatin 0.61398 0.14225 4.316 1.59e-05 ***
## ---
## Signif. codes: 0 '***' 0.001 '**' 0.01 '*' 0.05 '.' 0.1 ' ' 1
##
## (Dispersion parameter for binomial family taken to be 1)
##
## Null deviance: 884.35 on 682 degrees of freedom
## Residual deviance: 120.81 on 677 degrees of freedom
## (16 observations deleted due to missingness)
## AIC: 132.81
##
## Number of Fisher Scoring iterations: 8