Introduction
This book contains lab exercises for Module 11: Multi-modal Data Integration, as part of the Canadian Bioinformatics Workshop Cancer Analysis (CAN) Workshop.
Course materials
You can download course slides here
We will have two lab exercises, where we build patient classifiers using multi-modal data integration, using netDx.1,2
Data
For both lab exercises, we will use multi-modal breast cancer data from The Cancer Genome Atlas,3 and classify tumours by molecular subtypes originally defined using gene expression profiles.
In particular, we will focus on classifying tumours as being of either Luminal A, Luminal B, or Basal-like subtypes. These subtypes vary by prevalence, prognosis for survival and relapse, activated cellular signaling pathways, immunohistochemical markers and treatment options.4
, by BioRender, October 2020, Copyright 2021 by BioRender.](images/intrinsic-and-molecular-subtypes-of-breast-cancer.png)
Figure 1: Reprinted from Intrinsic and Molecular Subtypes of Breast Cancer, by BioRender, October 2020, Copyright 2021 by BioRender.
This dataset was selected because it has characteristics of a common use cancer in cancer genomics:
- There are pre-defined subtypes discovered using class discovery approaches (unsupervised methods such as clustering) OR defined by the clinical problem
- Subtypes are correlated with differences in clinical outcome and choice of treatment
- For the purposes of this lab, it is instructive to use subtypes with known cellular signaling pathways
Labs
LAB 1: A gentle introduction
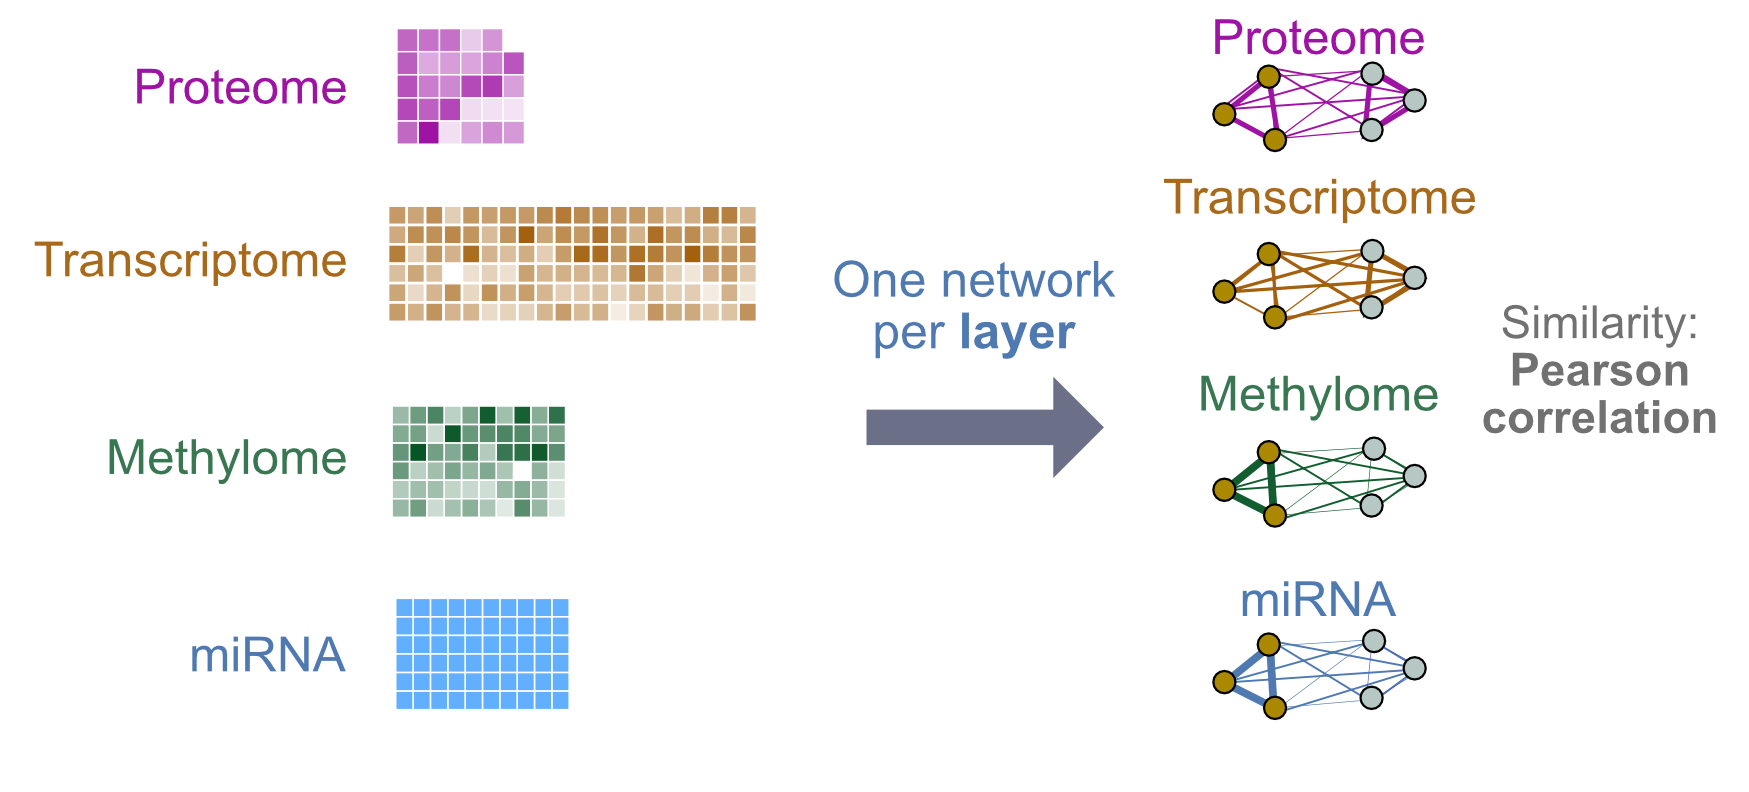
We will classify breast tumours as being one of three subtypes: Luminal A, Luminal B, and Basal-like. For this we will build a three-way classifier by integrating four types of -omic data: gene expression, miRNA, DNA methylation and proteomics. The design will be simple, using a single patient similarity network (feature) created from each layer. Similarity will be defined as pairwise Pearson correlation of profiles. Each network will use all measures from a given -omic data type (no filtering or grouping).
LAB 2: Pathway features & custom similarity metrics
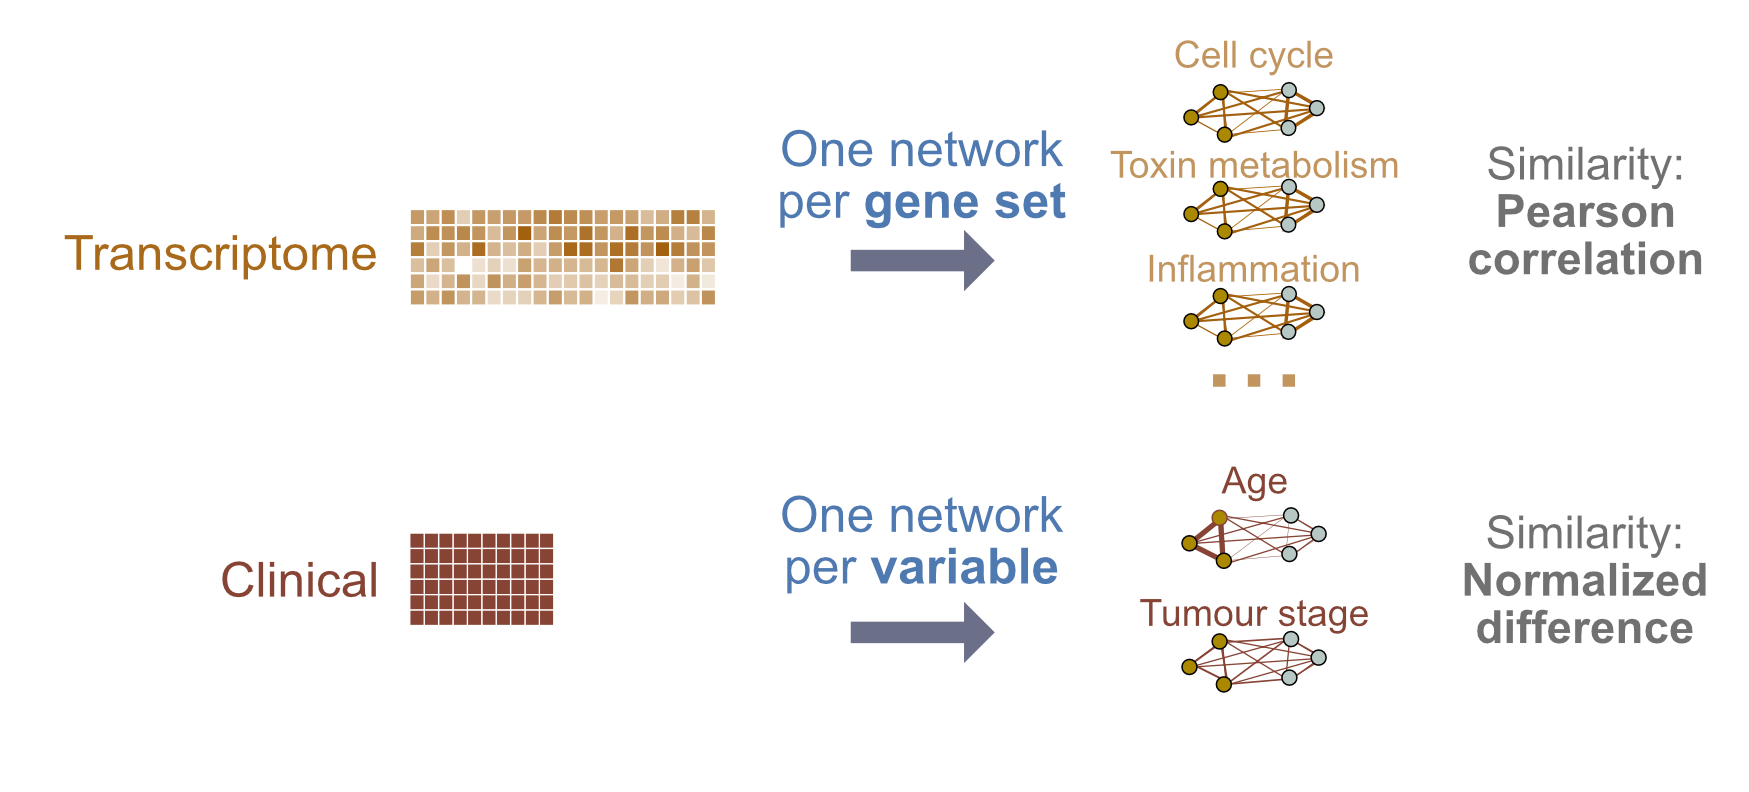
We will build a binary classifier of breast tumour subtype using gene expression and clinical data, but will use a slightly more complex design. We will define features at the pathway level for gene expression, so we can score pathways by their ability to predict outcome. With clinical data, we will define features at the level of individual clinical variables (e.g. age). We will also introduce the idea of using custom similarity metrics.
Instructions
- Labs will use Rstudio.
- Each lab will be provided as blocks of R code you will copy-paste into Rstudio to follow the building of the predictor. Code blocks to be pasted will be in yellow like so.
x <- 5If you hover your mouse over the block, you should see a little clipboard icon. Clicking on that icon will allow you to copy the block in one shot. I would use that.
In each case, the result of executing a code block is shown directly after the code, in grey blocks like the one below. These are not intended to be pasted in.
5Sometimes we show “pseudocode” or conceptual code blocks; these will also be in grey. None of these are intended to be pasted in.
# do not paste me in!
loop_over (all my patients){
    do something useful;
}
That’s about it!
Let’s go!
Post-script: Installing netDx on your own laptop
You will need:
$ sudo apt-get update
$ sudo apt-get install libxml2 zlib1g-dev libglpk40- In
R, install the following packages:
# install BioConductor
if (!requireNamespace("BiocManager", quietly = TRUE))
    install.packages("BiocManager")
BiocManager::install(version = "3.13") # could need 3.12 if R < 4.1

# install R dependencies
install.packages(c("ROCR", "pracma", "ggplot2", "glmnet",
  "igraph", "reshape2", "bigmemory", "doParallel",
  "foreach", "combinat", "rappdirs", "RColorBrewer",
  "Rtsne", "rmarkdown"))

# install BioConductor dependencies
BiocManager::install(c("RCy3", "biomaRt", "MultiAssayExperiment",
  "curatedTCGAData", "TCGAutils", "BiocFileCache",
  "GenomicRanges", "GenomeInfoDb", "IRanges",
  "scater", "clusterExperiment", "netSmooth",
  "BiocStyle","Rtsne"))

BiocManager::install("netDx")